Debunking whitewashed exam statistics
Edit (March 19, 2013): I updated my calculations at the end to no longer include phantom students. While their inclusion was meant to highlight a disregard of their needs, I inadvertently and unfairly ended up distorting the numbers in favor of my argument.
In “Why students fail entry-level programming exams” I referenced a lecture in which the resit was scheduled six months after the original exam. Said lecture did not offer any help in the interim, which I assumed would not yield an improved outcome over the first exam.
The results are in. I was right on target.
The official statistics for both exams as well as a provided summary are mirrored here:
These statistics leave a lot to be desired, with important pieces of information missing from the conclusion.
What they are selling
The officials combined the statistics of both exams in one contingency table. In the following representation, the y-axis describes the first exam while the x-axis describes the resit:
| not registered | no-shows | not graded | failed | passed | Sum | |
|---|---|---|---|---|---|---|
| Sum | 197 | 42 | 72 | 46 | 46 | 403 |
| not registered | — | 9 | 17 | 8 | 5 | 39 |
| no-shows | 65 | 14 | 17 | 9 | 4 | 109 |
| not graded | 17 | 3 | 14 | 2 | 4 | 40 |
| failed | 45 | 16 | 24 | 27 | 28 | 140 |
| passed | 70 | 0 | 0 | 0 | 5 | 75 |
From this, the following conclusion has been drawn:
| First exam | Second exam | After both | |
|---|---|---|---|
| graded | 100% (215) | 100% (92) | 100% (247) |
| failed | 65% (140) | 50% (46) | 53% (131) |
| passed | 35% (75) | 50% (46) | 47% (116) |
This table is meant to highlight one thing: 116 out of 247 students passed the exam. A quota of 47% is unexpectedly high, considering how “advanced” the topic is for many beginners attending the lecture.
The reason for this surprising conclusion is simple: it is misleading and masks vital information.
Why I am not buying it
There are several flaws in the argumentation that are not exactly hidden, but it requires a closer look in order to see how these statistics are misrepresenting the facts.
Resources seem more valuable than students
The first problem is an insult directed towards students. It does not appear in the data directly but has been added to the provided statistics: the officials blame both students who failed as well as no-shows for wasting resources.
Consider the available options:
- Students could register for the exam and not show up.
- Students could register, take the exam and opt out of having it graded. Their exams would be disregarded entirely.
- Student could register, take the exam and have it graded, meaning they could either pass or fail.
The officials complained about the fact that, for the first exam, 30% of registered students did not show up. Had these withdrawn their registrations, which was possible up until about a week before the exam, two rooms and four supervisors would not have been necessary. The number of no-shows slightly dropped to 20% for the second exam.
Additionally, more than half of the 140 students who failed were blamed for not opting out of having their exams graded. Had they realized during the exam that they would not be able to pass, they could have forfeited and saved the correctors a little time.
While certainly true, these arguments show a severe lack of empathy: exams should be about students, not organizers.
Chances are students neither failed nor stayed away out of spite, and the fact that this seems to be the officials’ main concern is problematic.
The option of not having your exam graded is rarely used, because some students tend to favor “passing with a bad grade” over “not passing at all”. Just barely making it should certainly not be something to aim for, but is an understandable goal considering failed lectures have to be taken again, adding to a later semester‘s predetermined and often heavy workload.
Not going to an exam one registered for is a decision that does not come easily, because it makes having to attend this lecture a second time a certainty. Not showing up is often the result of not getting a chance to prepare properly, which is not exclusively a matter of time, but more importantly of how well a subject has been taught.
Not standing a chance often only becomes clear within the last few days before an exam, sometimes even on the day of the exam. At this point, withdrawing your registration is no longer possible. When facing one‘s own incompetence, withdrawing a registration is rarely a primary concern anyways.
Instead of complaining about how students wasted the college‘s time (and potentially money), the focus should be on trying to identify their reasoning behind doing so in order to prevent the same from happening again.
Blaming those you were meant to teach for not learning is not going to motivate them to try harder.
Exam and lecture are not independent
The conclusion gives off the impression that 100% of exams have been graded when they clearly have not. The number of graded exams has been given way more relevance than it deserves.
The absence of two core demographics in the conclusion is obvious: neither no-shows nor those that opted out of having their exam graded are being taken into account.
These students certainly did not successfully attend the lecture. They may not have gotten a bad grade to prove it, but taking an exam and not passing should be considered equal to failure.
The given treatment wrongly separates the exams from the lecture as a whole. Success is purely measured in how many graded exams achieved a passing grade, those that did not actively take the exam are deemed irrelevant.
Fortunately, we have numbers for the missing demographics: the total number of students registered for one or both of the exams is 403.
If we shift the focus from “passing the exam” to “passing the lecture”, the quota drops from 47% (116 out of 247 students) to 29% (116 out of 403 students).
On the other hand, if we combine no-shows, opt-outs and those that failed the exam into a group “failing the lecture“, we end up with 71% (287 out of 403 students).
Let that sink in for a minute.
“Passing” does not equal success
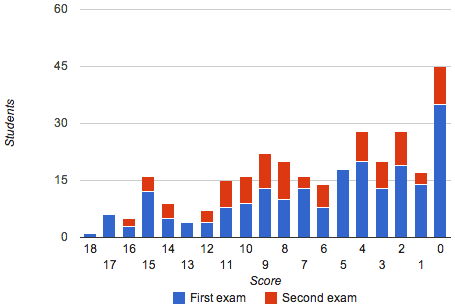
A student needs to achieve a minimum score of 40% in order to pass an exam. Knowing only those 40% does not mean someone understood the topic, it means they barely made it and do not have to take the exam again.
Both exams had a maximum score of 18 points, with a minimum of eight being required in order to pass. The lower grades have been achieved most often in both cases:
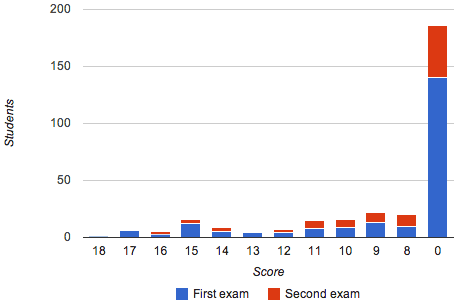
Since there is no practical difference between scores of seven and lower, they can be grouped together into a single class, represented in the following chart by a score of zero:
Even out of those that passed, the lower grades should not be considered successes. If we combine the top third of grades (13 to 18 out of 18 points) into a group of “passed successfully” and the remaining grades into “passed”, we get the following graph:
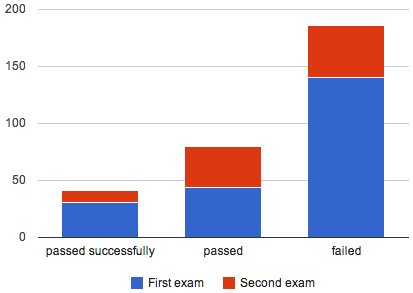
The groups are distributed unevenly, but roughly represent the actual classification.
Phantoms not considered
The contingency table only combines information tracked for the exams:
- how many students registered
- how many students did not show up
- how many students opted out of having their exam graded
- how many students failed
- how many students passed
The top left field has intentionally been left blank, because no data is available for it: lecture attendance has not been tracked, which makes is impossible to know how many students initially attended but did not end up taking either exam.
I personally know several people that attended at first, came to the conclusion they would never understand the subject, and then dropped Computer Science as their minor.
Assuming that the ones I know of are not isolated cases, it is save to assume that a relatively large number of students attended the lecture and ended up leaving Computer Science. Some might have changed their major or dropped out entirely.
My conservative guess is “at least 25 people”, but a number closer to 100 would not surprise me. These phantom students are not being taken into account when measuring the lecture‘s success.
Combining the findings
Even when ignoring the likely existence of phantom students, only 29% (116 out of 403 students) passed after both exams. To put it differently, fewer than one out of three students passed the lecture.
When taking out grades below B-, the number of “successful” attendants drops from 116 to 48, which leaves only 12% (48 out of 403 students).
This result is still a tiny bit too optimistic, because it potentially counts the five students that took both exams twice, which is incorrect if their results fell into the considered range both times.
The outcome does not change by a lot when accounting for that possibility: one out of nine students successfully passed the lecture.
Several others passed with a more limited understanding of what has been taught, while 71% failed the lecture.
When assuming any number of phantom students, these numbers shift in favor of “failing”.
Conclusion
The actual result, when considering the entire lecture, lies far below the official success rate of 47%. Even when considering “barely passing” a success, fewer than one out of three students actually succeeded.
The only aspect under which this is acceptable is if this lecture was aimed at weeding out beginners struggling with the subject by not giving them a fighting chance. If the motivation lies in the actual education of students, this lecture should be considered a failure.
Whitewashing the facts cannot hide the red flags in these results. The subject at hand may be “advanced” considering the audience, but failure rates of this magnitude can and should be avoided.